

Case Study: How Grant County is Using Data to Drive Tourism
By Christopher Kellner, BCS Management
In a rapidly shifting economic landscape, county commissioners and tourism directors face a shared challenge: proving the return on investment (ROI) of travel marketing while attracting a new generation of visitors. Traditional tourism campaigns often rely on fragmented spreadsheets and lagging outcome metrics, leaving public decision-makers asking if tax dollars are truly driving local commerce.
A recent report by Boston Consulting Group (BCG), “Five Ways to Boost Marketing ROI Across Travel” (DeStein et al., Feb. 2026), highlights that maximizing marketing returns requires moving beyond passive advertising toward data-informed, agile, and integrated visitor experiences.
The Grant County Convention & Visitors Bureau (GCCVB), operating under the brand Simply Grant, recognized that transitioning “from anecdote to evidence” required a modern digital foundation. To achieve this vision, the GCCVB partnered with BCS Management to build a state-of-the-art digital gateway and leveraged Table Top for enterprise-grade fractional data analytics.

Setting a New Standard with Show Me Grant County
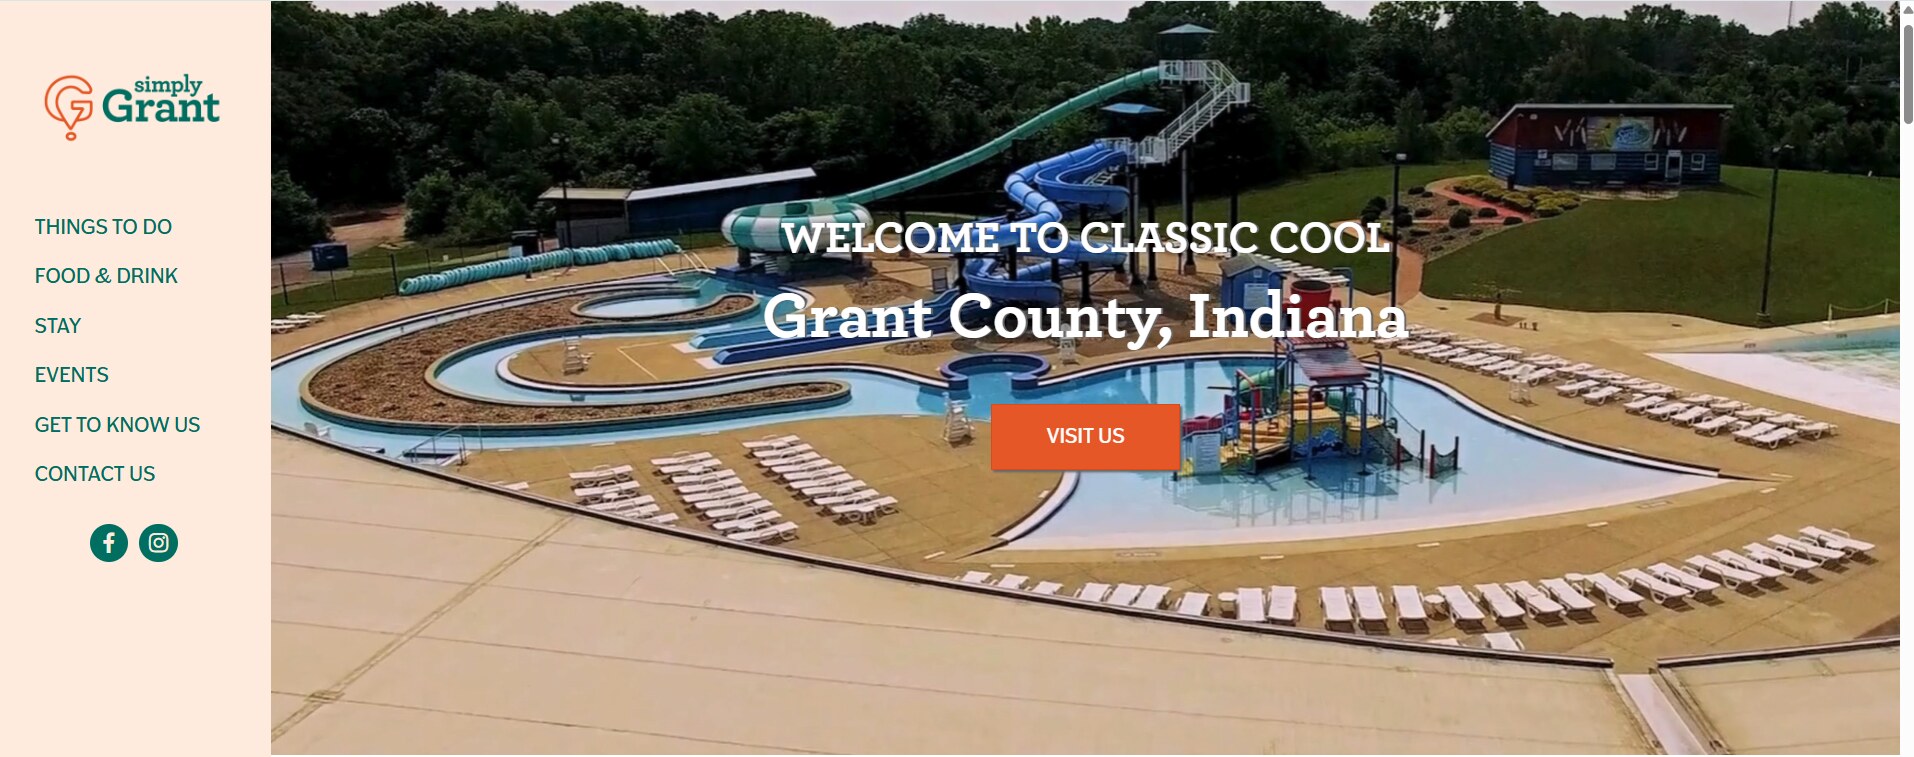
A destination’s website serves as its primary digital front door. BCS Management led the overall strategy, brand architecture, user experience design, and technical engineering behind the brand-new Show Me Grant County web platform. The objective was twofold: deliver an inviting, mobile-optimized experience for prospective visitors while embedding a robust data-collection engine beneath the surface.
Under the leadership of Lana Beregszazi (BCS Founder & CEO), the initiative aligned the web platform directly with Grant County’s long-term economic development goals. BCS team members Connor Grieb and Jason Rister architected the front-end user experience and backend functionality, ensuring seamless navigation, dynamic community event calendars, and native tracking integrations.
Unifying the Ecosystem with Table Top Data Analytics
Building a high-converting website is only the first step; measuring visitor intent and physical travel behavior completes the equation. To create a unified data ecosystem, BCS partnered with Table Top, a firm providing fractional data analytics and reporting teams.
Instead of forcing local municipal entities to hire costly, full-time in-house data science departments, Table Top delivers continuous data pipeline engineering and custom business intelligence. Christopher Kellner, who serves as Managing Director at BCS and CEO of Table Top, led the strategic alignment between web architecture and quantitative analysis. Chris Robertson, Table Top’s COO and Lead Software Engineer, designed automated Python ETL (Extract, Transform, Load) scripts that continuously ingest, clean, and join data into a central, secure PostgreSQL data warehouse.
This unified technical architecture integrates four primary data streams:
- Actual Visits (Placer.ai): Tracks anonymized physical visitor volumes, median dwell times, and origin market heatmaps for out-of-market travelers.
- Website Performance (Google Analytics 4): Monitors unique active users, referral channels, and on-site event conversions on showmegrantcounty.com.
- Social Media Reach (Meta Business Suite): Measures ad impressions, content interactions, and demographic profiles across Facebook and Instagram.
- Economic Impact (Innkeeper’s Tax Receipts): Sourced monthly from county financial records to monitor hotel occupancy and lodging revenue trends.
Connecting Digital Visits to “Heads in Beds”
By analyzing data from both leading and lagging indicators, Grant County implemented the core principles outlined in BCG’s marketing ROI framework. Digital engagements on Show Me Grant County and social channels serve as leading indicators of traveler interest, while physical visitor counts (Placer.ai) and monthly Innkeeper’s Tax receipts act as lagging indicators that confirm physical travel and real-world economic impact.
To deliver these insights directly to leadership, the joint team established a two-tiered reporting suite:
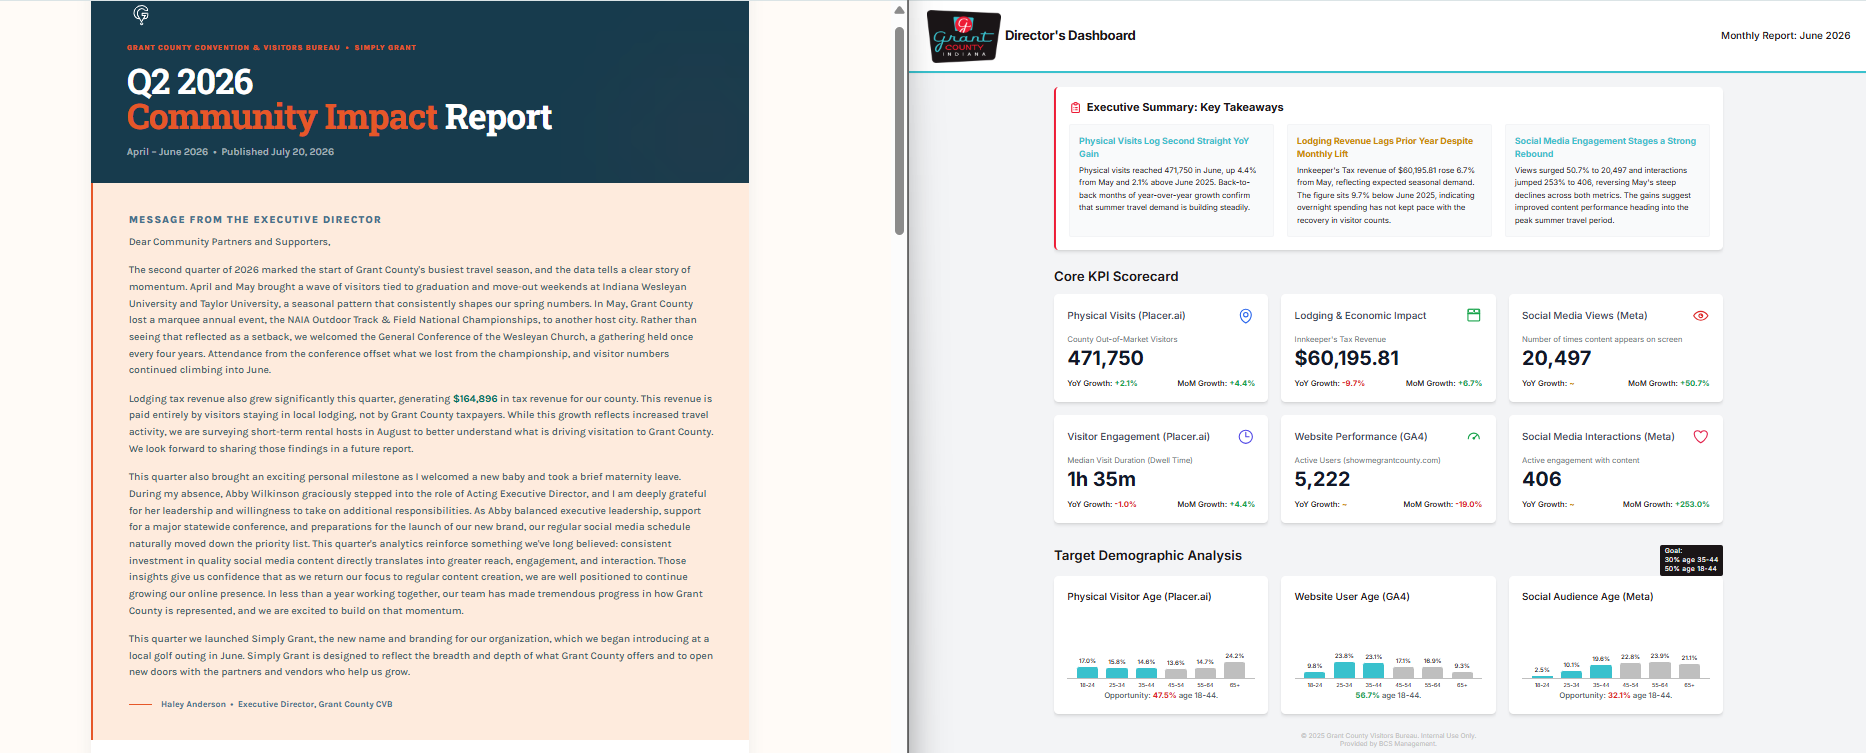
- The Monthly Director’s Dashboard (Internal & Tactical): An operational scorecard for CVB leadership featuring Month-over-Month (MoM) and Year-over-Year (YoY) KPI trends, executive summaries, and age bracket analysis specifically tracking engagement among younger families (ages 18-44).
- The Quarterly Community Impact Report (External & Strategic): A high-impact, public-facing publication for county commissioners, city councils, and local business partners. It communicates regional economic impact and incorporates an integrated call-to-action fundraising model to make the analytics program self-sustaining over time.
As a prerequisite to building the Dashboard and Quarterly Report structures, BCS and Table Top facilitated a workshop with CVB leadership to define a Data Strategy Blueprint to guide the data analysis and reporting program. This living document continues to evolve with the organization.
Meet the Team Behind the Transformation
- Lana Beregszazi (BCS Founder & CEO): Brings decades of strategic leadership in economic development, municipal operations, and public sector growth strategy.
- Justin Saathoff (BCS): Focused on project management, client relationship management, and execution for website development.
- Connor Grieb (BCS): Focuses on modern web development, user experience optimization, and digital brand integration.
- Jason Rister (BCS): Specializes in backend platform architecture, system functionality testing, and technical web engineering.
- Christopher Kellner (BCS Managing Director, Table Top CEO): Bridges business strategy with technical execution, aligning analytics directly with municipal economic goals.
- Chris Robertson (Table Top COO & Software Engineer): Architect of the PostgreSQL database environment, automated Python ETL data pipelines, and front-end/HTML delivery of reports.
By replacing fragmented manual exports with a semi-automated (“human in the loop”) data ecosystem, Grant County demonstrates how municipal leaders can maximize tourism ROI. For county commissioners evaluating public resource allocation and CVB directors aiming to expand their destination brand, the Show Me Grant County project offers a repeatable model: pair a high-converting digital platform with fractional data science to turn visitor data into economic growth through aligned strategy and action.